- June 24, 2020
Mini Research Projects
Visiting home country, I was very fortunate to join UX Lab at Seoul National University (SNU) almost right upon arrival, and was able to get a glimpse of how research in human-computer interaction (HCI) is being conducted in academia. In fact, I wanted to reassure myself that my theoretical knowledge in user research: experimental design, qualitative methodologies, etc, is on the right track in a strict academic setting.
— Project 1. Living Lab | Project 2. Web Directory (The HCI Society of Korea)
01. Living Lab 🏠
Background
The initial drive of this project is a sharp growth in the number of single households here in S.Korea. — Our goal was to build a service to cater for their “undiscovered” needs. I was very fortunate to dive right in at the earliest phase of the research when there being no established research questions, hypothesis, or whatsoever.
Question — “Would living alone as single households affect how they spend their personal hours?”
01. EXPLORATION – We then have planned semi-structured interviews with potential users in their 20 – 40s for explorative purposes to accumulate foundational insights. The process included: 1) writing interview scripts, 2) screening & recruiting participants, 3) setting out a pre-analysis plan, etc.
02. PILOT STUDIES – Before starting, we conducted a pilot study within ourselves (10+) to iteratively review the interview scripts, sampling methods, and pre-analysis plans.

03. RECRUITING – We used snowball sampling (referral) when recruiting participants and were able to receive responses from 45+ candidates. We then sent out recording consent forms with a short description of what the research is about.
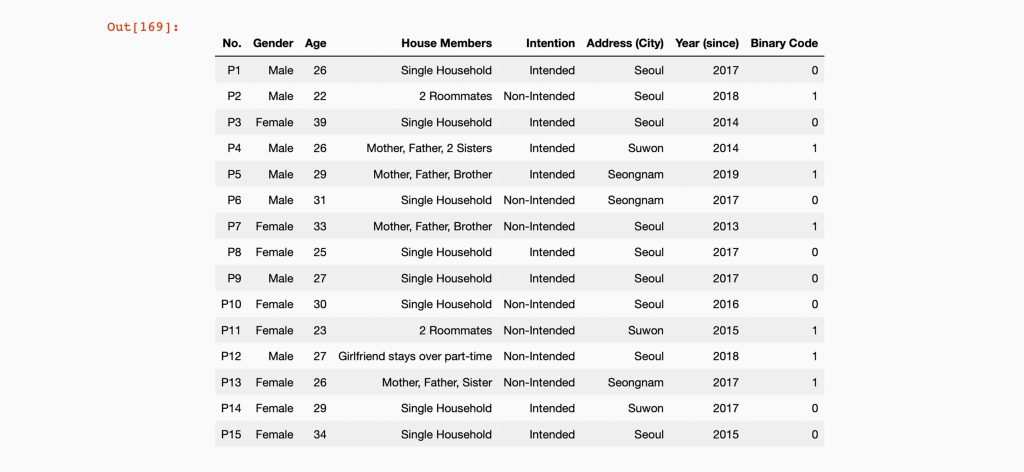
Table 1. Interviewee Details
04. SCREENING – To determine their eligibility for participation, we conducted screening via email, asking them to fill out a couple of very simple questions — 30 participants were selected.
05. INTERVIEWING – Due to the COVID19 pandemic, all the interviews were conducted remotely via Zoom/Google Hangouts. Each moderator-notetaker team conducted semi-structured interviews with participants for 40+ minutes for each in duration, asking questions about their recent activities & hobbies during their personal time. The whole sessions have been recorded after verbal notice.

Fig 2. Stenography – Interview Transcript
— Since the questions mostly relate to their personal life, rapport came as a priority to let participants speak their minds in a comfortable setting, avoiding the Hawthorne effect.
06. QUALITATIVE ANALYSIS – Collecting/recording data (text bundles) from the interviews, we labeled every sentence and paragraph with tags for content analysis using Reframer, as we wanted to see if there are patterns in the data. We then transitioned to thematic analysis, where we can group sentences and paragraphs based on their affinity.
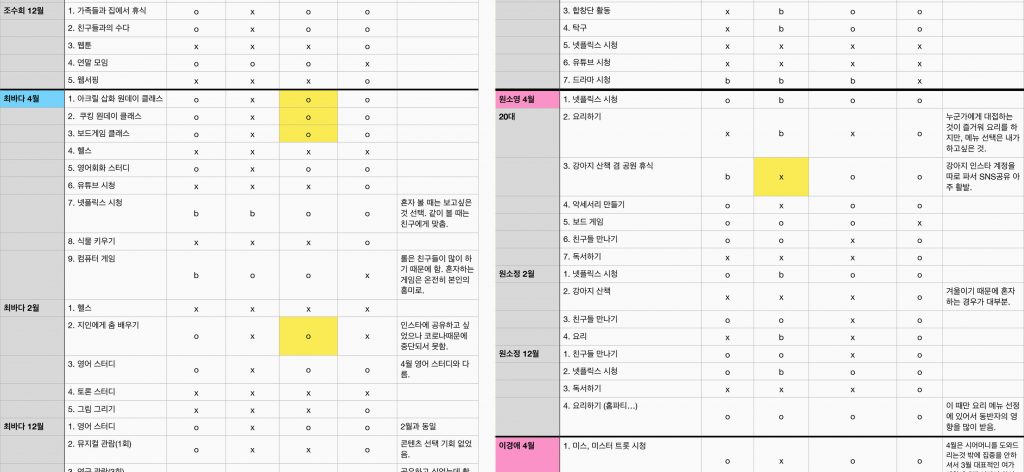
Fig 3. Content Analysis – Quantifying Qualitative Data
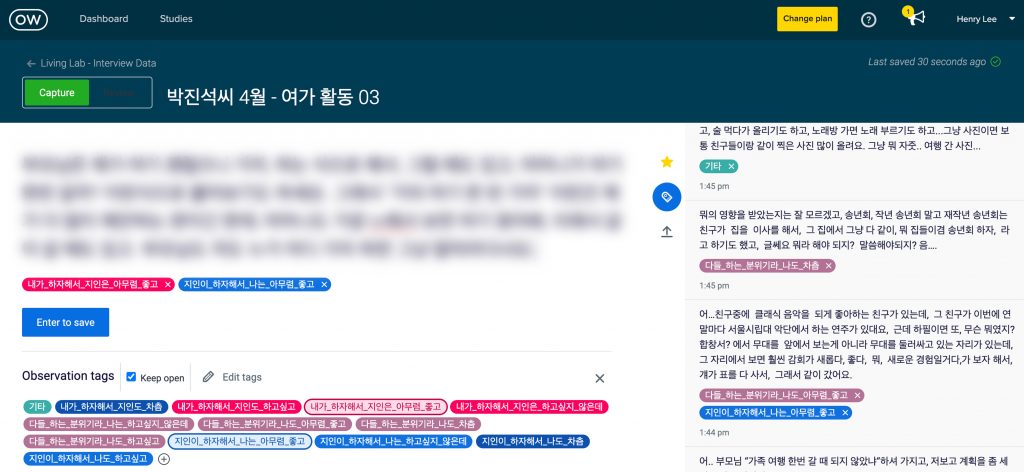
Fig 4. Thematic Analysis – Affinity Grouping
— Our aim was to analyze participants’ behavior by their inclination when they are on activities. e.g., how they make decisions, set out plans, and most importantly; would living as single households affect their decision making process?
— Causality: One of the insights we discovered was you are inclined to be influenced by such extrinsic motivations as peer pressure, etc, when you are a single household. (since you have no close companions as comparison targets currently living together with you.)
07. NUMERICAL DATA – Closing the interviews, we asked participants to hand in their recent screen time data (iOS) to supplement our qualitative research findings. Here’s one interesting pattern I’d like to showcase: X Axis – the period of time (year) since they became single households. / Y Axis – how long in a week (4 weeks mean value) they’ve been on SNS & Entertainment apps.
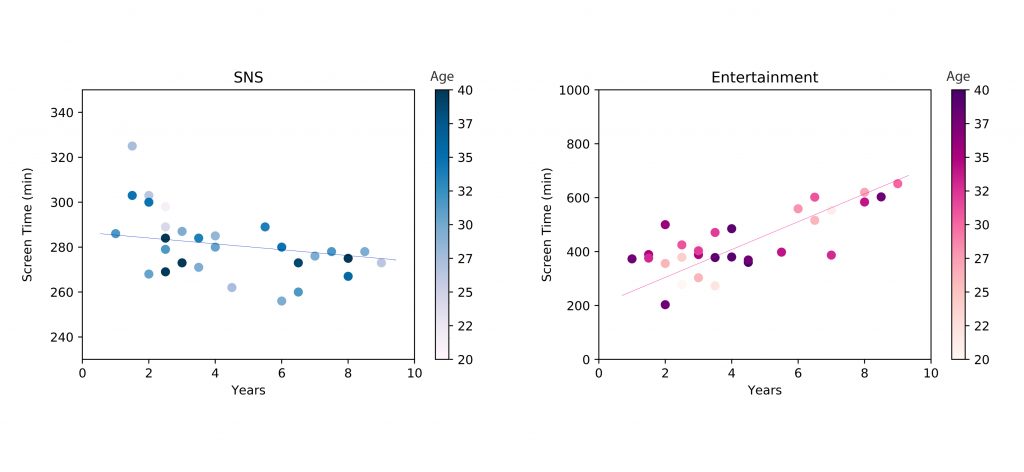
Fig 5. Correlation Analysis – iOS Screen Time
*The project is still ongoing.
–
02. Web Directory – Information Architecture 🗂
Background
Students, fresh out of college, or some professionals hoping to transition, develop, elevate their career start to pursue post-graduate opportunities. However, according to our observation, a clear majority of applicants are struggling to find a good fit. — Most of them make tentative decisions, almost conveniently believing popular universities would have better programs when they know next to nothing about what their academic interests are.
— Students are also left uncertain, often torn between choices. Some universities are heavily concentrated with applicants when others are losing the battle.
How can we help applicants make well-informed decisions (with objective and fair criteria) ?
01. OBJECTIVES – To help applicants land on a better starting point in search, we decided to build a web directory as a leverage to walk you through the list of schools with HCI laboratories/programs. To realize that, we started collecting, recording, and aggregating data to create a university database. Funded by The HCI Society of Korea, the database was structured based on publications submitted by each program/head professor. — We selected publications as a primary indicator because they represent each program’s research area. They are also free from bias and unquantifiable measures such as popularity, he-said-she-said, etc.

02. EVALUATIVE RESEARCH – Starting out, we discovered several other websites providing lists of programs/universities with the similar objectives. We evaluated such websites: topuxschool.com, masterstudies.com, etc, using usability heuristics.
03. EXPLORATION (INTERVIEWING) – We then spoke to stakeholders (mostly researchers and professors in HCI) and also conducted interviews with 15+ applicants to see what & why they are struggling. — Their struggles often lead them to relying upon some limited, often very subjective information from blogs, Youtube, etc.
04. MENTAL MODEL – Based on the interviews, we created a mental model diagram to analyze the applicants’ mental states throughout their experience. *Click the diagram below to activate the view. — As can be seen, applicants get frustrated, discouraged for various reasons.
05. DATABASE – Moving on, we constructed a university database in SQL server. — We looked at institutions running HCI laboratories/programs and selectively recorded the ones that submitted publications to the HCI Society of Korea in 2018/19.
Ref. Example Queries:
#
#
# Query 01. Counting universities & laboratories

  SELECT
      COUNT(DISTINCT 학교)
  FROM mytable
  WHERE 학교 is NOT NULL

  SELECT
      COUNT(DISTINCT 연구실)
  FROM mytable
  WHERE 연구실 is NOT NULL

# Query 02. Searching by Tags/Keywords

  SELECT * FROM mytable
  WHERE 키워드 LIKE '%웨어러블%' OR '%유비쿼터스%'
  GROUP BY
      번호
  ORDER BY
      연도 DESC LIMIT 10
#
#
The aggregate total — 56 Universities, 168 Labs, 1,375 Tags (publication keywords)
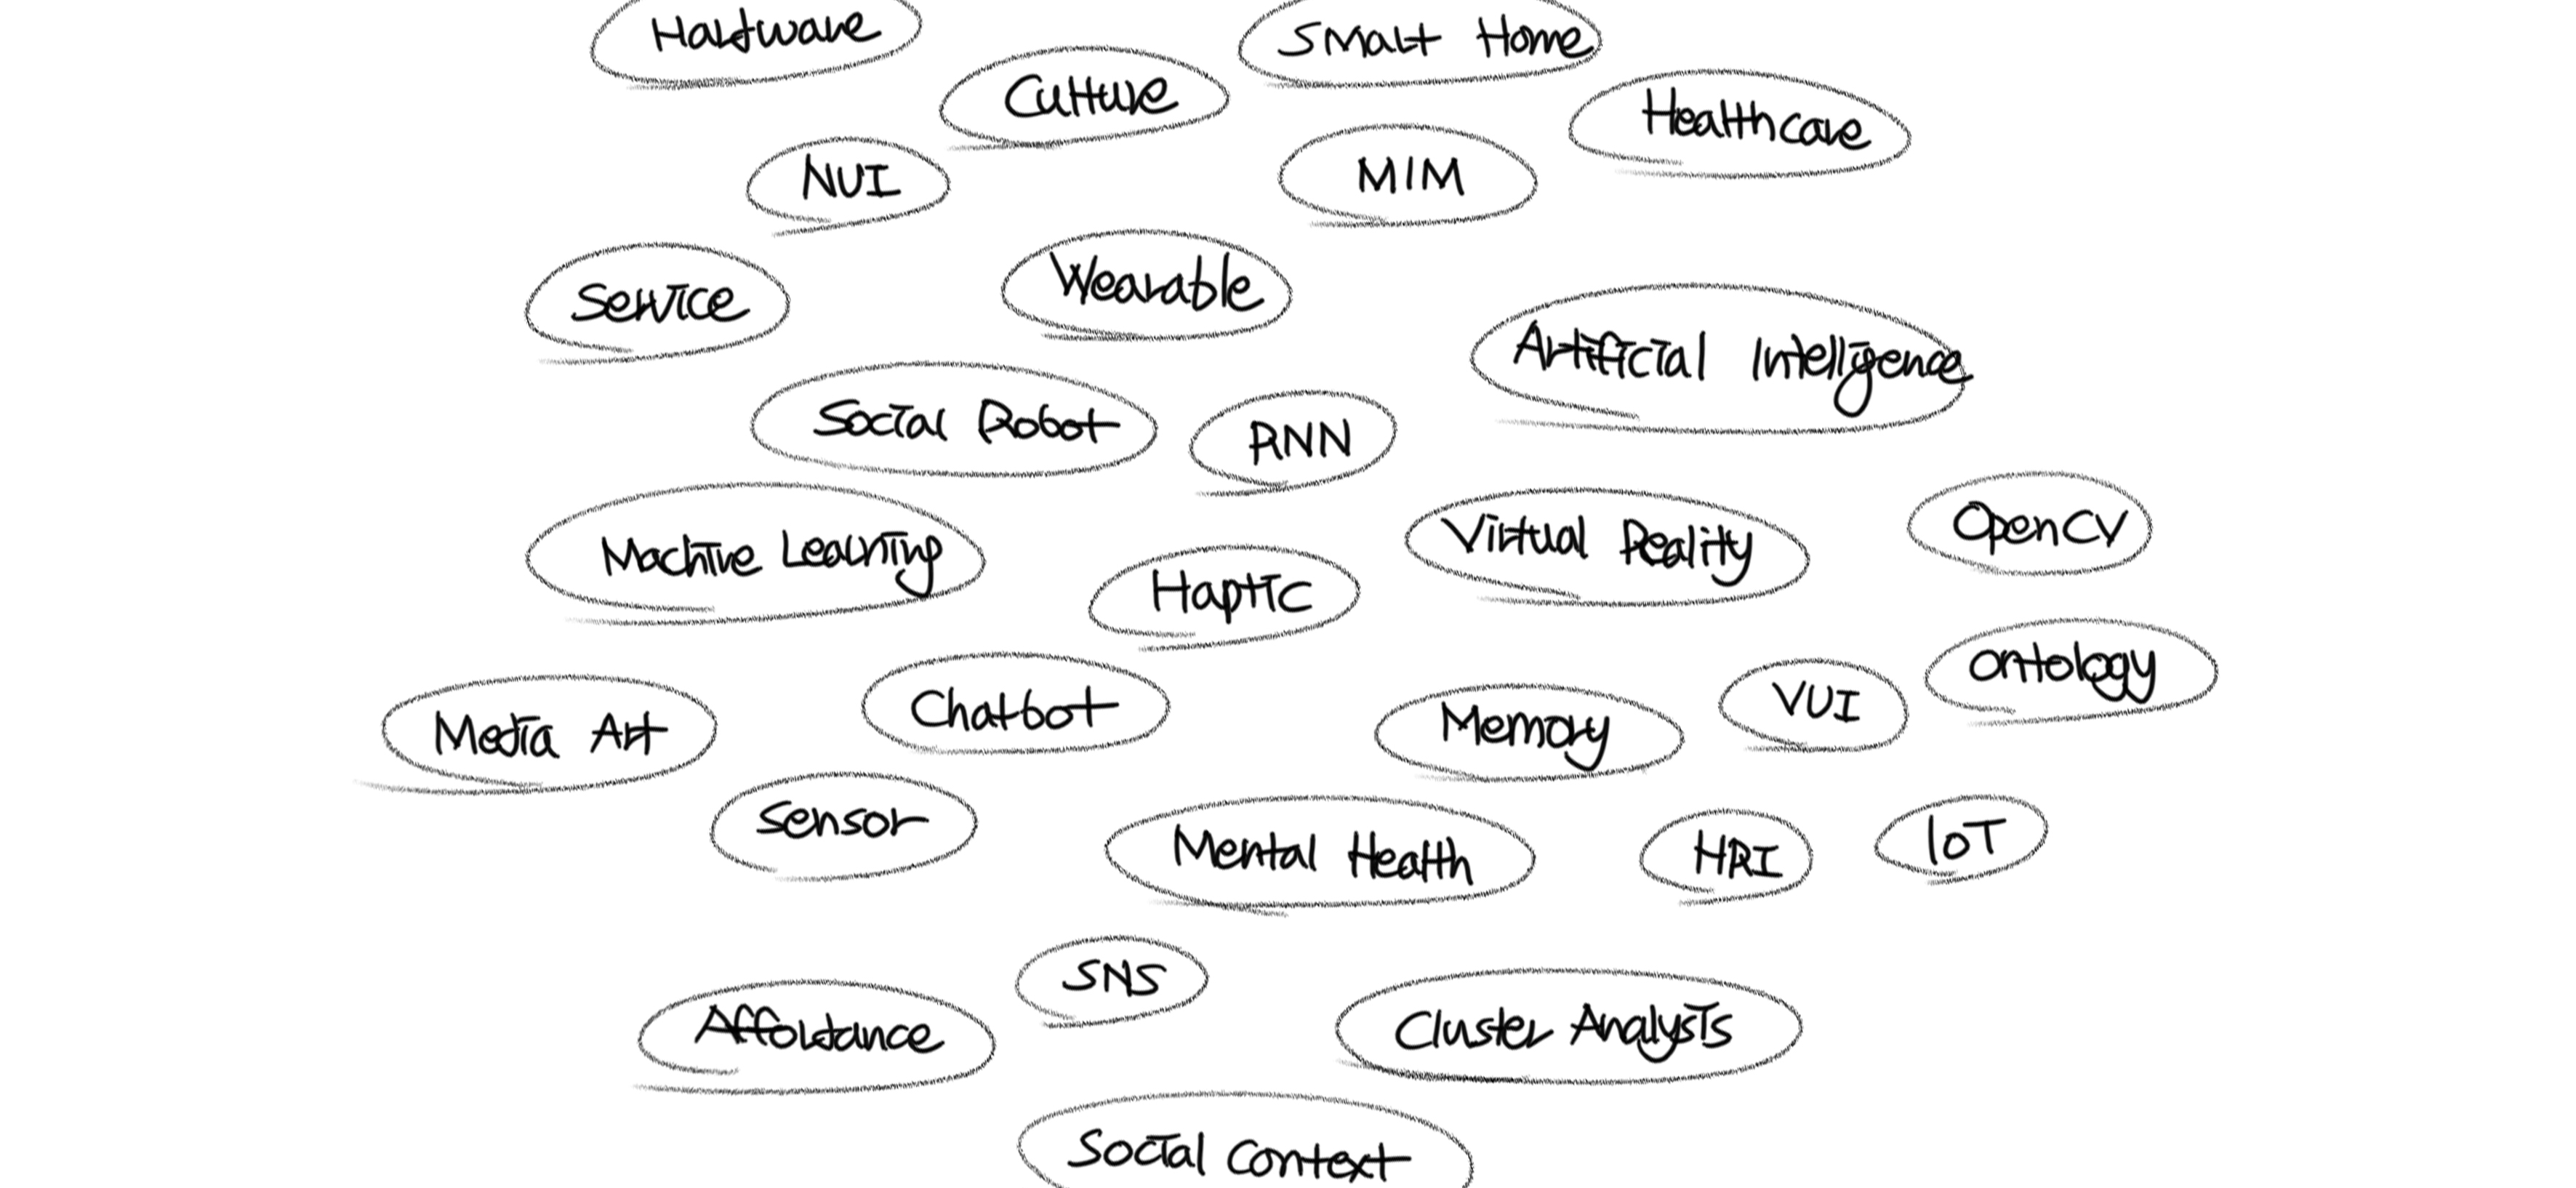
06. TEXT ANALYSIS – We then created a tag cloud, using NLTK in Python to visualize tags (publication keywords) so we can have a bird’s eye view on the data to begin with.
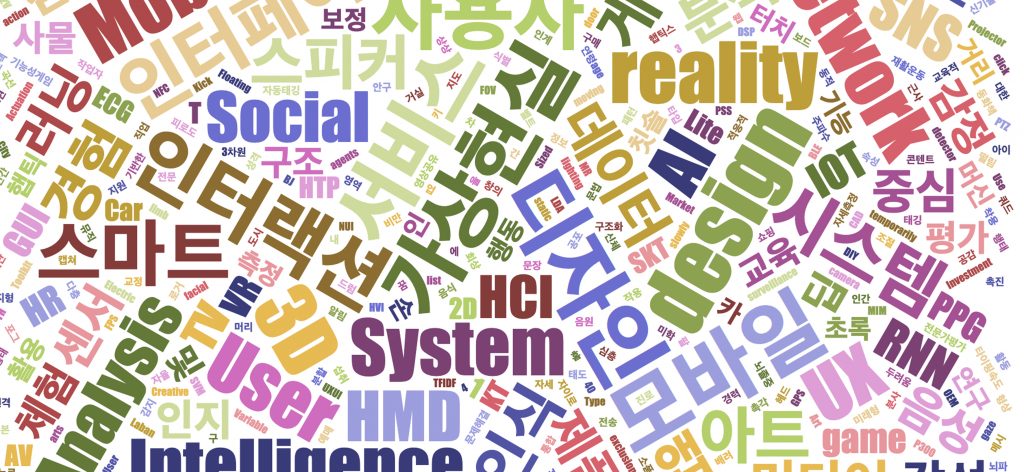
07. INFORMATION ARCHITECTURE (IA) – To implement a bubble-up folksonomy using tags (publication keywords), we have reviewed and iterated various classification schemes through several different methods to see if there are patterns in data (to group by).
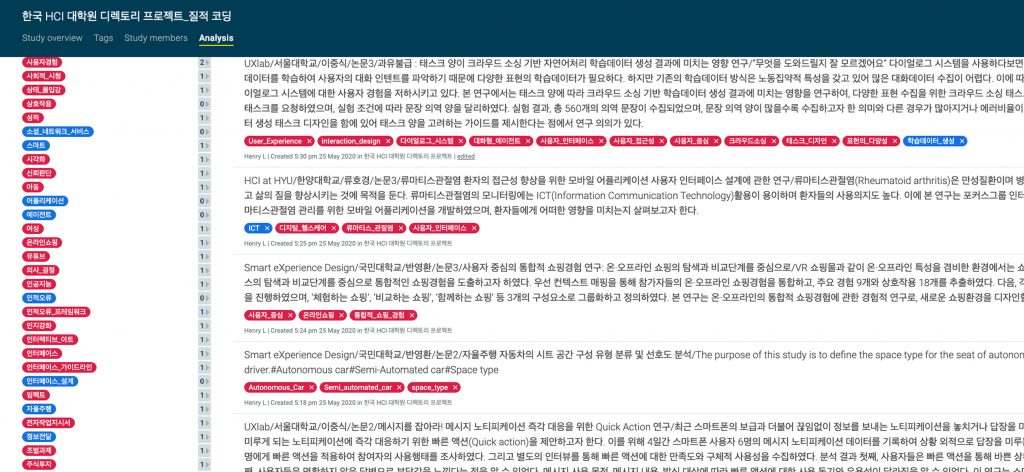
07-1. Attempt 1 (Qualitative Coding & Content Analysis) – As an initial attempt, writing a code book, we started labelling every abstract of publication with tags for qualitative coding. — Cons: labelling text data by their nature can be subjective, pervaded with bias.
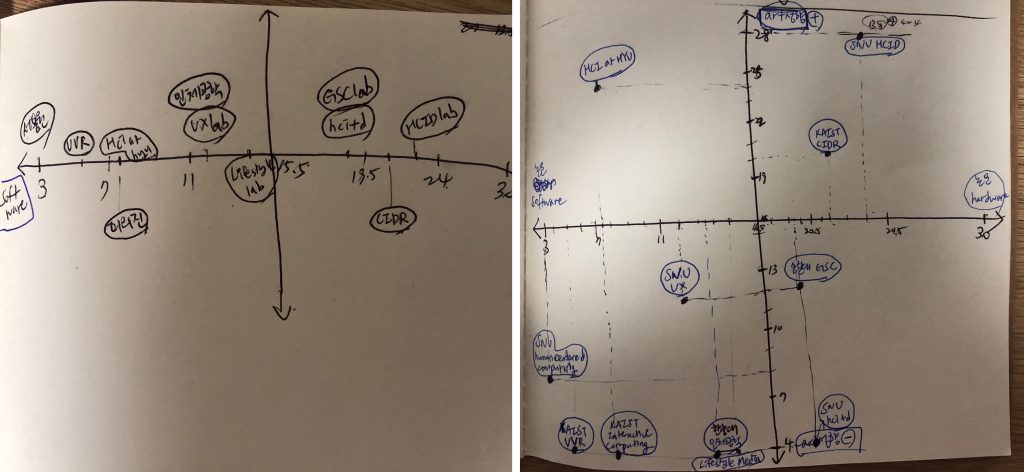
07-2. Attempt 2 – We then switched to drawing a quadrant to find patterns in data (tags) based on closeness of each tag — Cons: classification may become subjective as researchers’ perception on each tag may vary. Cluster analysis (K-means) can be performed, but considering the whole point of the project, we needed to group tags to cater for applicants’ needs, not for the sake of classification itself.
07-3. Attempt 3 (Card Sorting) – we also organized a few card sorting sessions within ourselves including stakeholders. — Cons: we weren’t able to recruit applicants this time as it was untimely, considering the deadline for application was approaching.
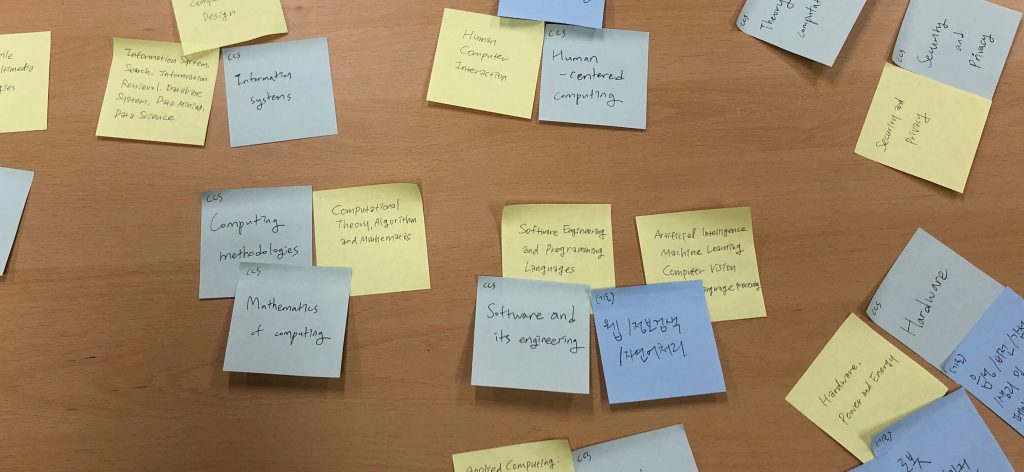
07-4. Attempt 4 – As part of our final attempt, we created a new scheme for classification, using both CCS tags (created by The HCI Society of Korea) and publication tags (aggregated/coded by us). Following is the process we went through: recording data in SQL server — normalizing publication tags — grouping the tags by their affinity based on CCS.

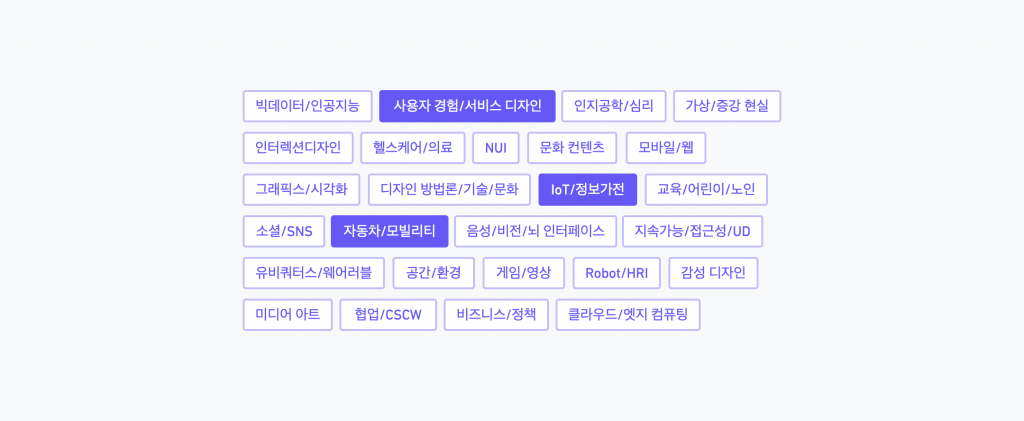
— We came up with 26 final categories (clusters) at the end:

08. METAPHOR – Websites/directories out there are using taxsonomies, filtered/categorized by regions, course types (research/taught), etc. They are effective when applicants know exactly what they are looking for (just as a dictionary), but nearly obsolete when applicants are unfamiliar with the topic. We came up with ‘car navigation’ as a metaphor to refer to its proactive nature.

09. CONTENT CURATION – We then devised an algorithm behind contents. — Based on tags (publication keywords), we grouped universities & laboratories with stories/articles. — Users need to fill out a short questionnaire (optional) about their research interests as they visit the website for the first time, so they can view custom contents on carousel in the form of collaborative curation.

10. WIREFRAMES – Going through the user insights we have collected, we came up with four wireframes & flowcharts. We then tested them with applicants while only providing the brief context of what they are. We also ditched a search field on home page as we assume the applicants only have vague ideas or understandings of what they are looking for, also promoting tags/filter-based search behaviour. (The scenario for returning visitors who may be a bit more informed/educated may vary.)
*Click to view InVision Wireframe or you can simply pan around on the image below:
11. APPENDIX
One of the perks I had while working on this dataset is I get to see recent research trends in HCI academia with a bird’s-eye view of at least 1-5 years. I plotted some graphs out of curiosity using Matplotlib, and here’s one of the trends I find interesting:
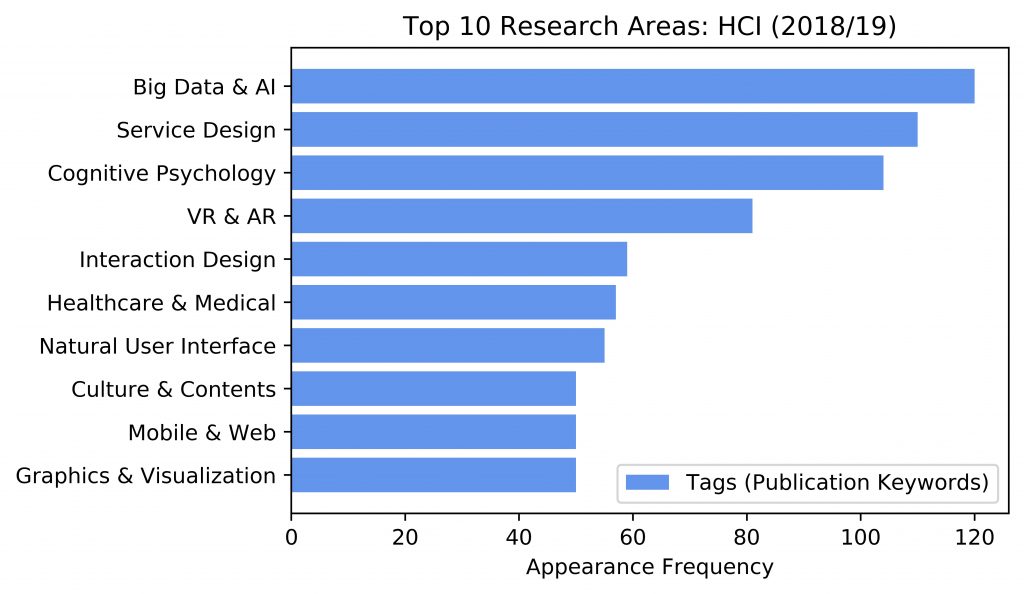
Fig 2-1. Top 10 popular research areas in HCI (Korea) by publication tags (keywords)