- July 10, 2020
— Unsupervised Machine Learning Techniques To Inform User Research 🔬
1. Background
“Bottom-up approach in data analysis” — Starting with the data and working up to insights
Data science has long been a hot topic, and there’s nothing more popular about it than machine learning. But, how can traditional user/design researchers like myself 🤔 lean on machine learning to test hypotheses and assumptions, and understand more about users?
— This is a rework of what I did earlier for QualitativeX at an early phase of foundational research. In 2018, I was building a business out of my initial startup idea. I knew I was meant to launch and learn quickly to move forward as an early startup, but I had a very vague understanding about the user, no clue about what problem they might have. I then, decided to investigate data, asking myself which machine learning techniques I can use to inform, supplement generative research when I had no idea about the user.
2. Techniques
- Unsupervised Learning for Generative Research
K-Means & K-Medoids Clustering — Persona & User Segmentation ☑️
K-Means & K-Medoids Clustering — Affinitization (Thematic Analysis) ☑️
- Supervised Learning for Evaluative Research
Linear Regression — Predictive Analysis
Logistic Regression — Classification
Decision Tree — Classification
- Little bit of both…
Content Analysis + NLP Techniques — Text (Interview) Analysis ☑️
Sentiment Analysis — Text (Comment & Reviews) Analysis ☑️
3. Work Flow — Data Mining
1. Brainstorming — Planning out strategies for data mining. Which data do I need? How can I integrate it into design, strategy, etc.?
2. Data Preprocessing (SQL Server) — Storing raw data in SQL server, I was able to access and preprocess data simply by writing queries to aggregate data for further analysis.
3. Bottom-Up Data Mining (RapidMiner) — As mentioned, I nearly had no clue about users and their problems at first. I looked at a pile of existing data to extract insights in a bottom-up manner — learn about potential users, group them together, and understand how they operate.
4. Visualisation & Reporting — Initially, I was the only one who consumes data. But when I faced investors and partners, they became a serious audience for analysis.
— Material: Survey (Mental Health in Tech) — There exist various trends in tech that created such buzzwords: geek economy, sharing economy, co-working space, etc… In order to investigate how people work in such diverse ways under these circumstances, I wanted to get insights about their happiness and welfare.
— Data Type — Mostly numerical, but contains some text (corpus) and poly/bi-nominal data.
4. Case 01 – User Segmentation for Persona
We always like to slice, group users into a few representative personas (or segments in this case) as researchers. Back then, we relied heavily on a subjective analysis, but persona can be scientific with this data mining technique known as K-Means (or X-Means) Clustering.
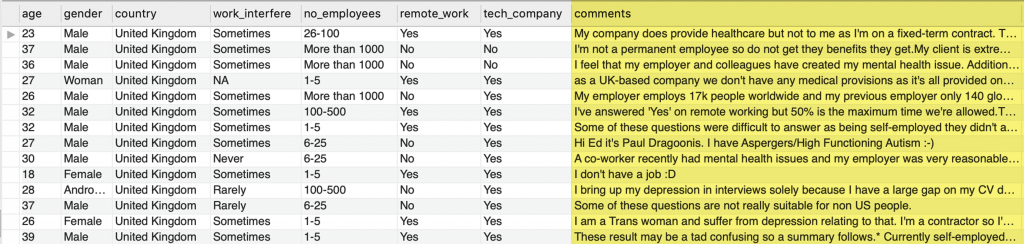
Here’s the dataset:
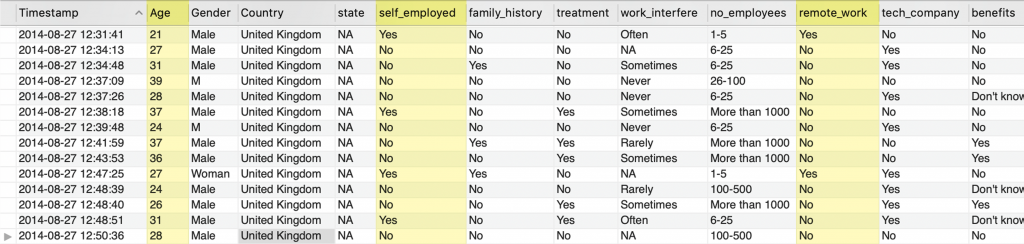
SQL Server Dataset – United Kingdom
1. Data Aggregation — SQL
Selecting, aggregating data (columns/attributes) to import to RapidMiner for further analysis.
2. Data Preprocessing
1. Replacing missing values with the average value
2. Correcting human errors, e.g. typing mistakes, spaces, etc.
3. Transforming nominal data into numerical data to enable clustering with Euclidean Distance
4. Normalizing (Standardizing) Data to avoid weighted values
3. Selecting Attributes for Initial Analysis
– Initial Clustering — Age (Int), Self_employed (Bi-nominal), and Remote_work (Bi-nominal)
– Others (Reviewing other affinities) — Tech company, No_employees, etc.
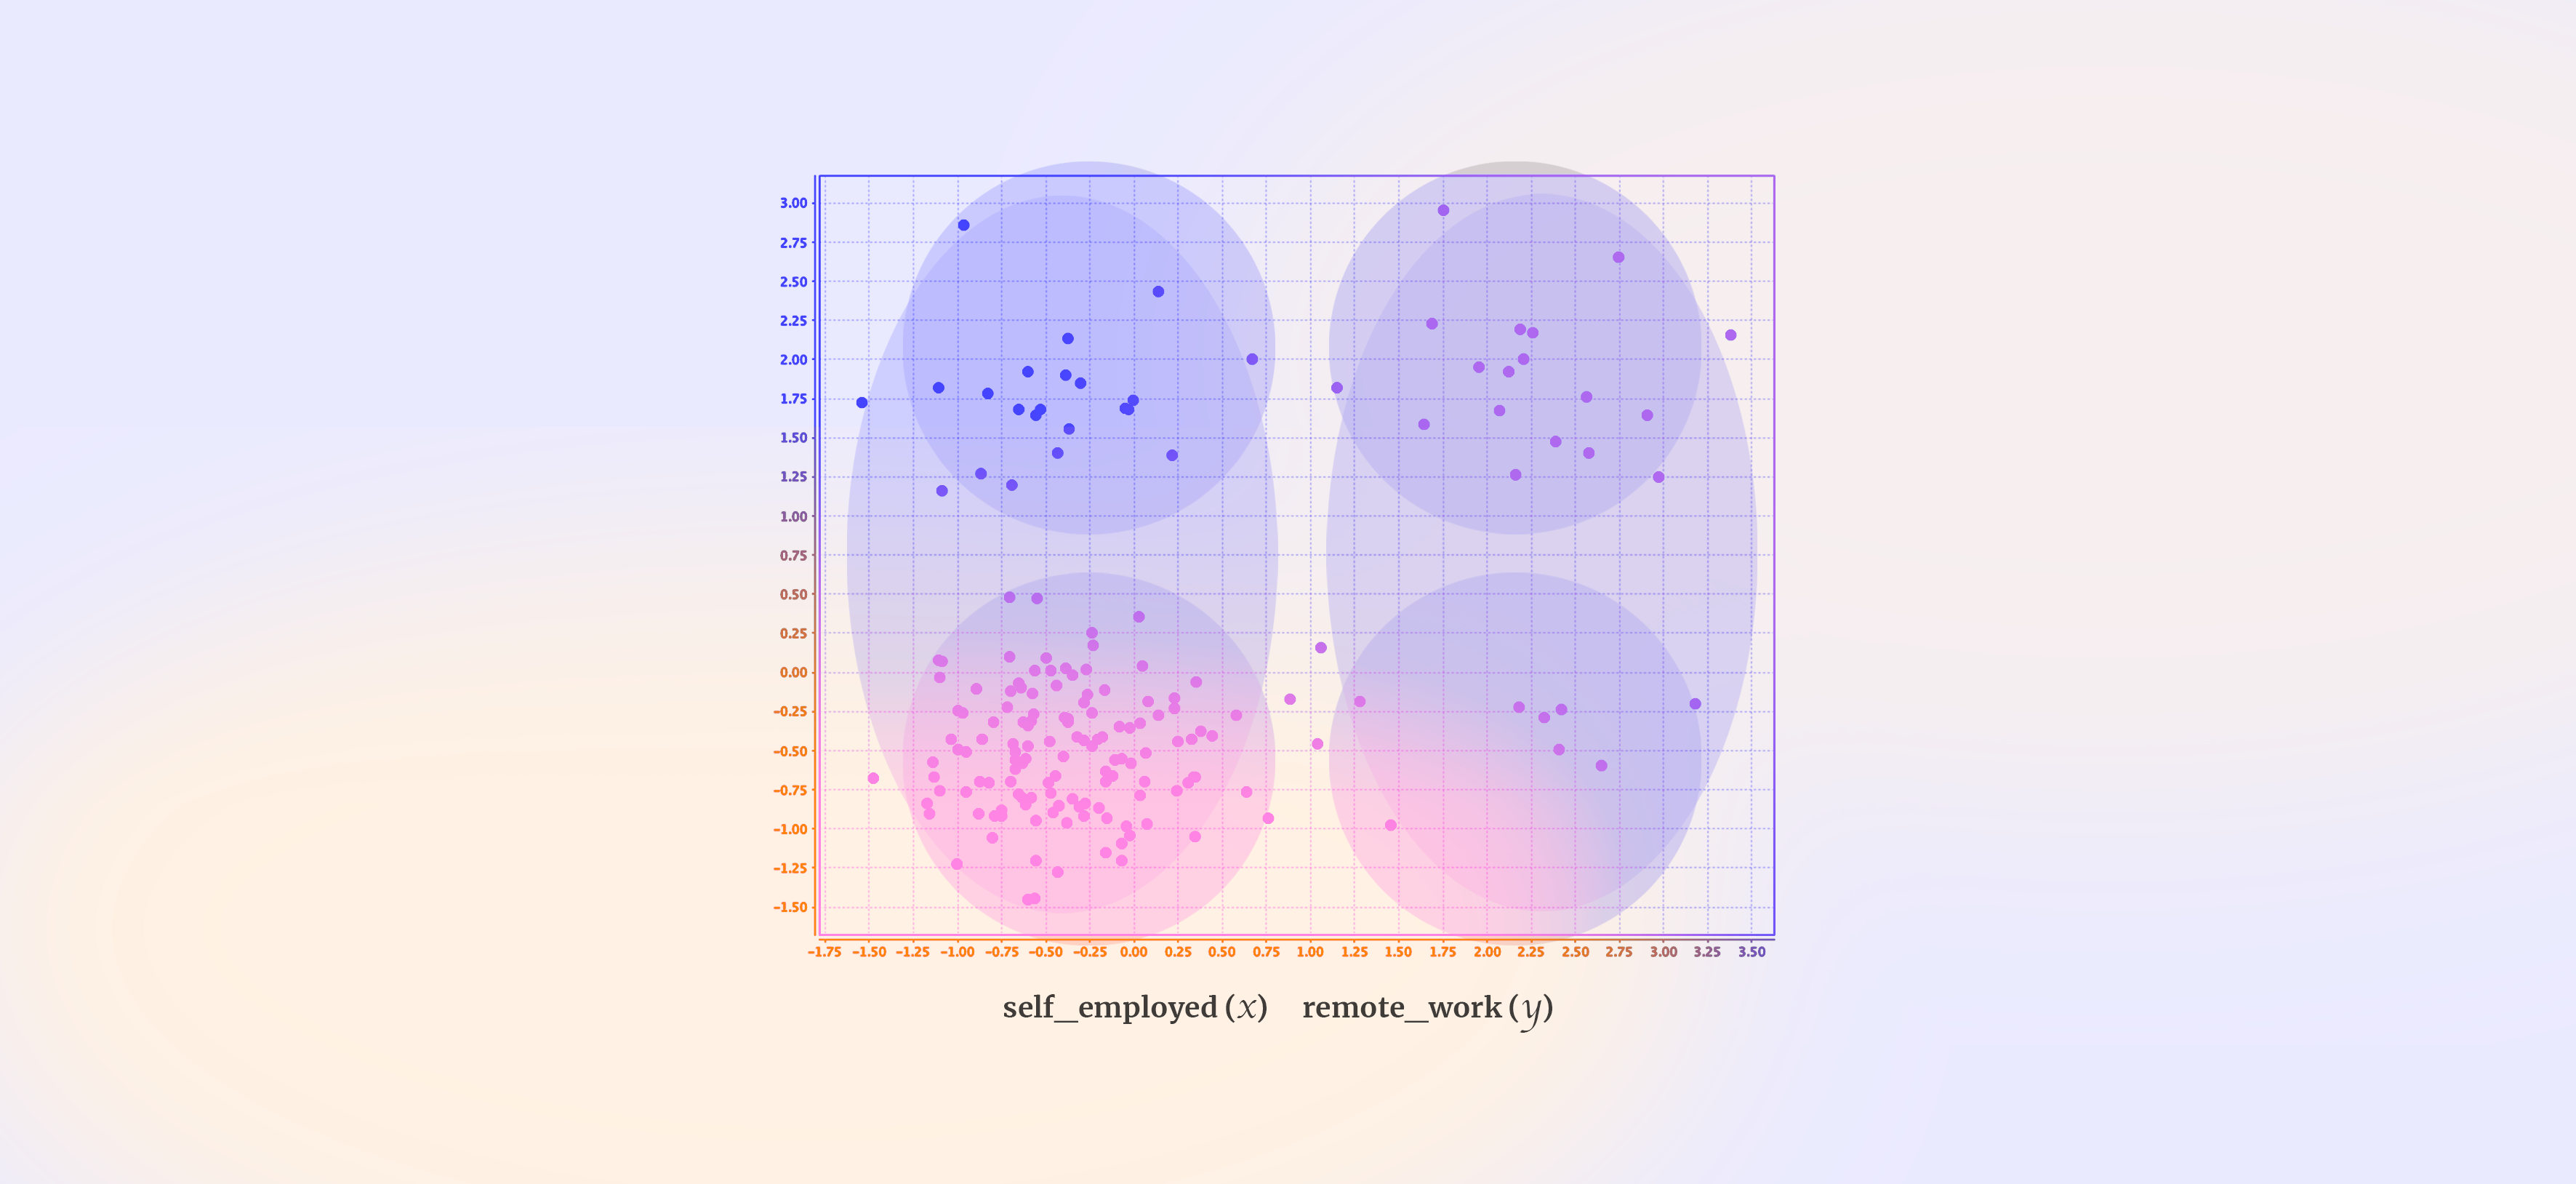
4. The Optimal Number of Clusters K (Elbow Method)
Without knowing the optimal number of clusters, I used X-Means algorithm (K min: 2, K max: 10) to identify the number of clusters within the data. The algorithm generated 2 big clusters (right) as can be seen on the below visualization. And I also set 4 clusters (left) so I can compare.
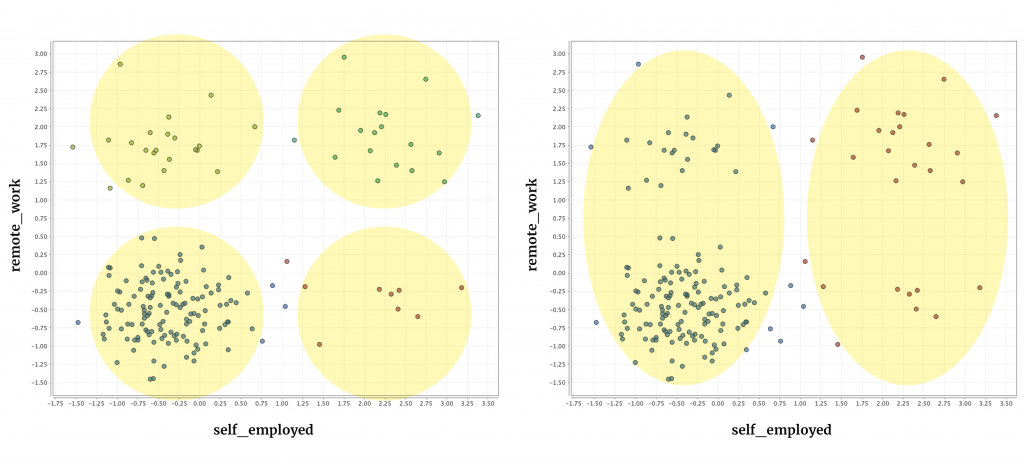
K-Means (random initialization) — 4 clusters (left), X-Means — 2 clusters (right)
I also created centroid tables to confirm that the data is distributed with adequate distances for clustering. As can be seen, the chart on the right with 2 clusters performed much better without there being no intersecting points.
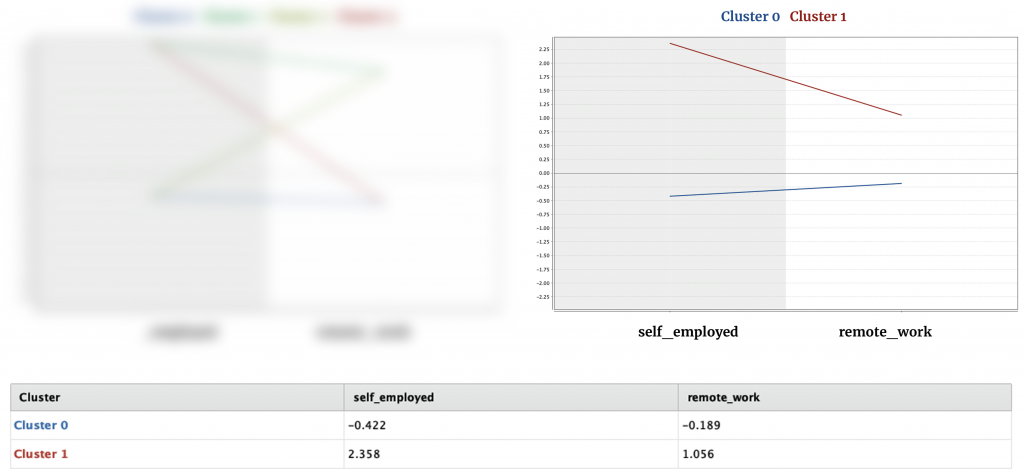
Centroid tables that show the disparity
5. User Segments & Persona Prototyping
To recap, I was able to generate 2 clusters with distinct characters.
– Cluster 0: People (UK) in this cluster work as an employee at a small/big organization, without having chances to work remotely (outside of an office) at least 50% of the time.
– Cluster 1: People (UK) in this cluster are mostly self-employed and they occasionally work outside of an office.
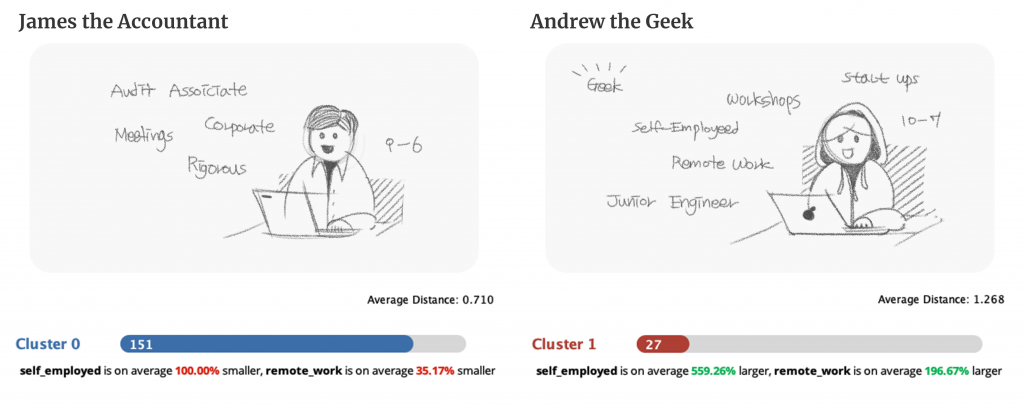
Clusters (Segmentation)
— Of course these are just 2 variables (Attributes), but this analysis provides a good foundational insights for further analysis in persona mapping. Now that I have 2 clusters, I can generate subgroups inside them.
5. Case 02 – Text Analysis
To analyze unstructured data within the dataset, e.g. users’ comments (text corpus), I used NLP techniques: Tokenizing — Transforming Cases — Filtering Stopwords — Stemming (Porter) — Filtering Tokens — (Generating n-Grams).
1. Word Vector (Comments)
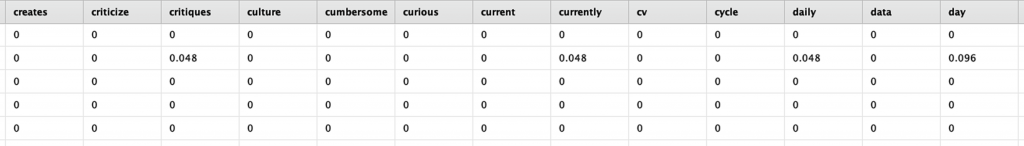
Term Frequency (TF-IDF Score)
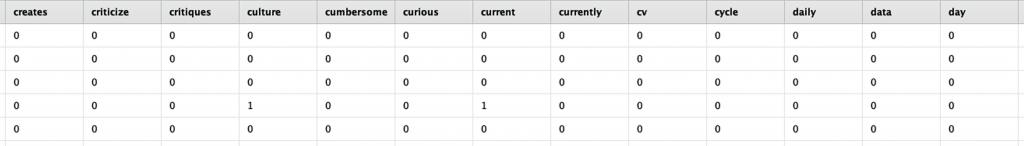
Term Counts
2. Sentiment Analysis — Survey Comments
First of all, I conducted sentiment analysis, expecting the majority of comments would be negative as the survey is about mental health in tech, in relation to remote work, leave, corporate welfare, hierarchy, etc. *Though the data has a bias since those who commented on the survey tend to be more critical to problems & issues.
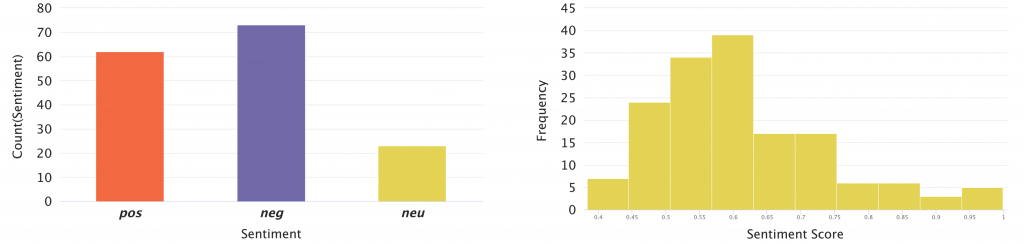
Sentiment Analysis + Score Distribution — Skewed Bell Curve
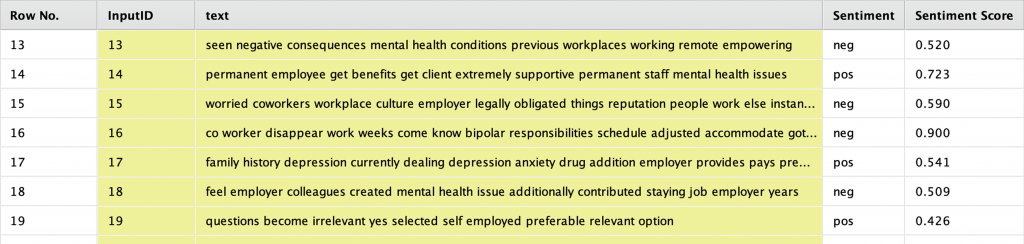
Observations
3. Topic Modelling
To understand general discussions and contexts, I used topic modelling algorithms to briefly summarise and categorize what they are saying into groups.
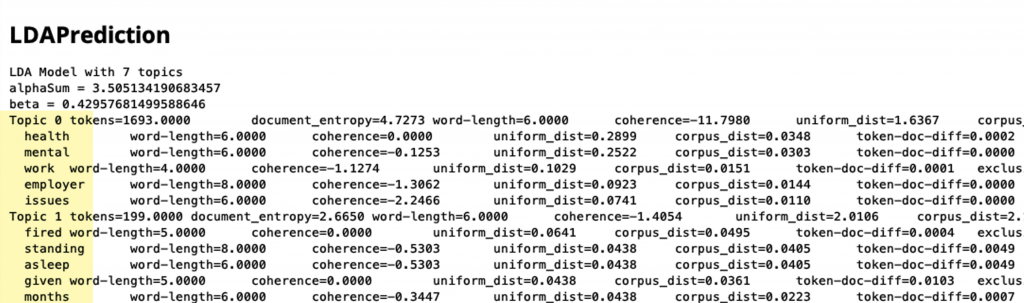
LDA Prediction with 7 Topics
Iteration 1. 10 Topics
Topic 1. — self, bipolar, future, place, faith
Topic 2. — affect, value(s), therapist, program
Topic 3. — personal, topic, acceptable, generally, support
Topic 4. — fired, standing, asleep, given, work(ed)
Topic 5. — health, mental, work, employer, issues
Topic 6. — months, manager, understand, told, took
Topic 7. — community, get, ucr, getting, f***ing
Topic 8. — women, anonymous, sessions, relationship, happier
Topic 9. — treatment, lost, year, offer, vacation
Topic 10. — lucky, bring, consider, episodes, side
Iteration 2. 7 Topics
Topic 1. (tokens=1693.0000) — health, mental, work, employer, issues
Topic 2. (tokens=199.0000) — fired, standing, asleep, given, months
Topic 3. (tokens=183.0000) — related, non, psychiatrist, medication, area
Topic 4. (tokens=199.0000) — community, bipolar, went, policies, drug
Topic 5. (tokens=188.0000) — good, free, face, women, understand
Topic 6. (tokens=213.0000) — understand, months, manager, told, took
Topic 7. (tokens=240.0000) — treatment, supervisor, time, office, lost
Reference — Semantic Similarity
— As can be seen, the similarity of each comment varies adequately, and there could be various different topics. This technique can later add value to finding affinities for interview transcripts, articles, etc.
Each comment is very different.
4. Grouping Comments by Affinity
Creating personas with comments might sound a bit off since many of us would cast a doubt on whether the comments are truly representative for each observation. However, it helped categorize issues & problems by their affinity as participants expressed their thoughts from a critical viewpoint through comments.
Comments
Question — “Are these comments good representatives of all participants?” — Well, at least we can group them with distinguishable attributes.
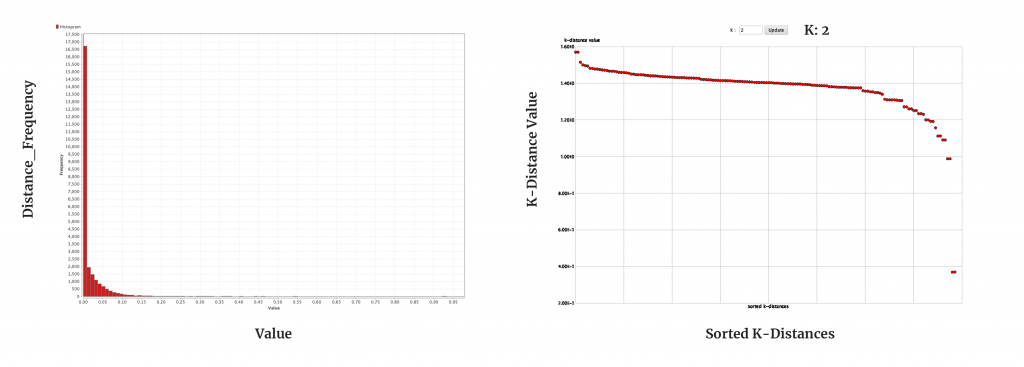
Clustering Algorithm
Using K-Medoid algorithm, I went through a couple of iterations with different number of clusters. With these 10 clusters as a result, I was able to create stories, connecting keywords.
– Numerical TF-IDF
– Number of Clusters 3 – 7 10 (Iteration)
– Distance Measure: Squared Euclidean Distance
– Average Cluster Distance 1.729
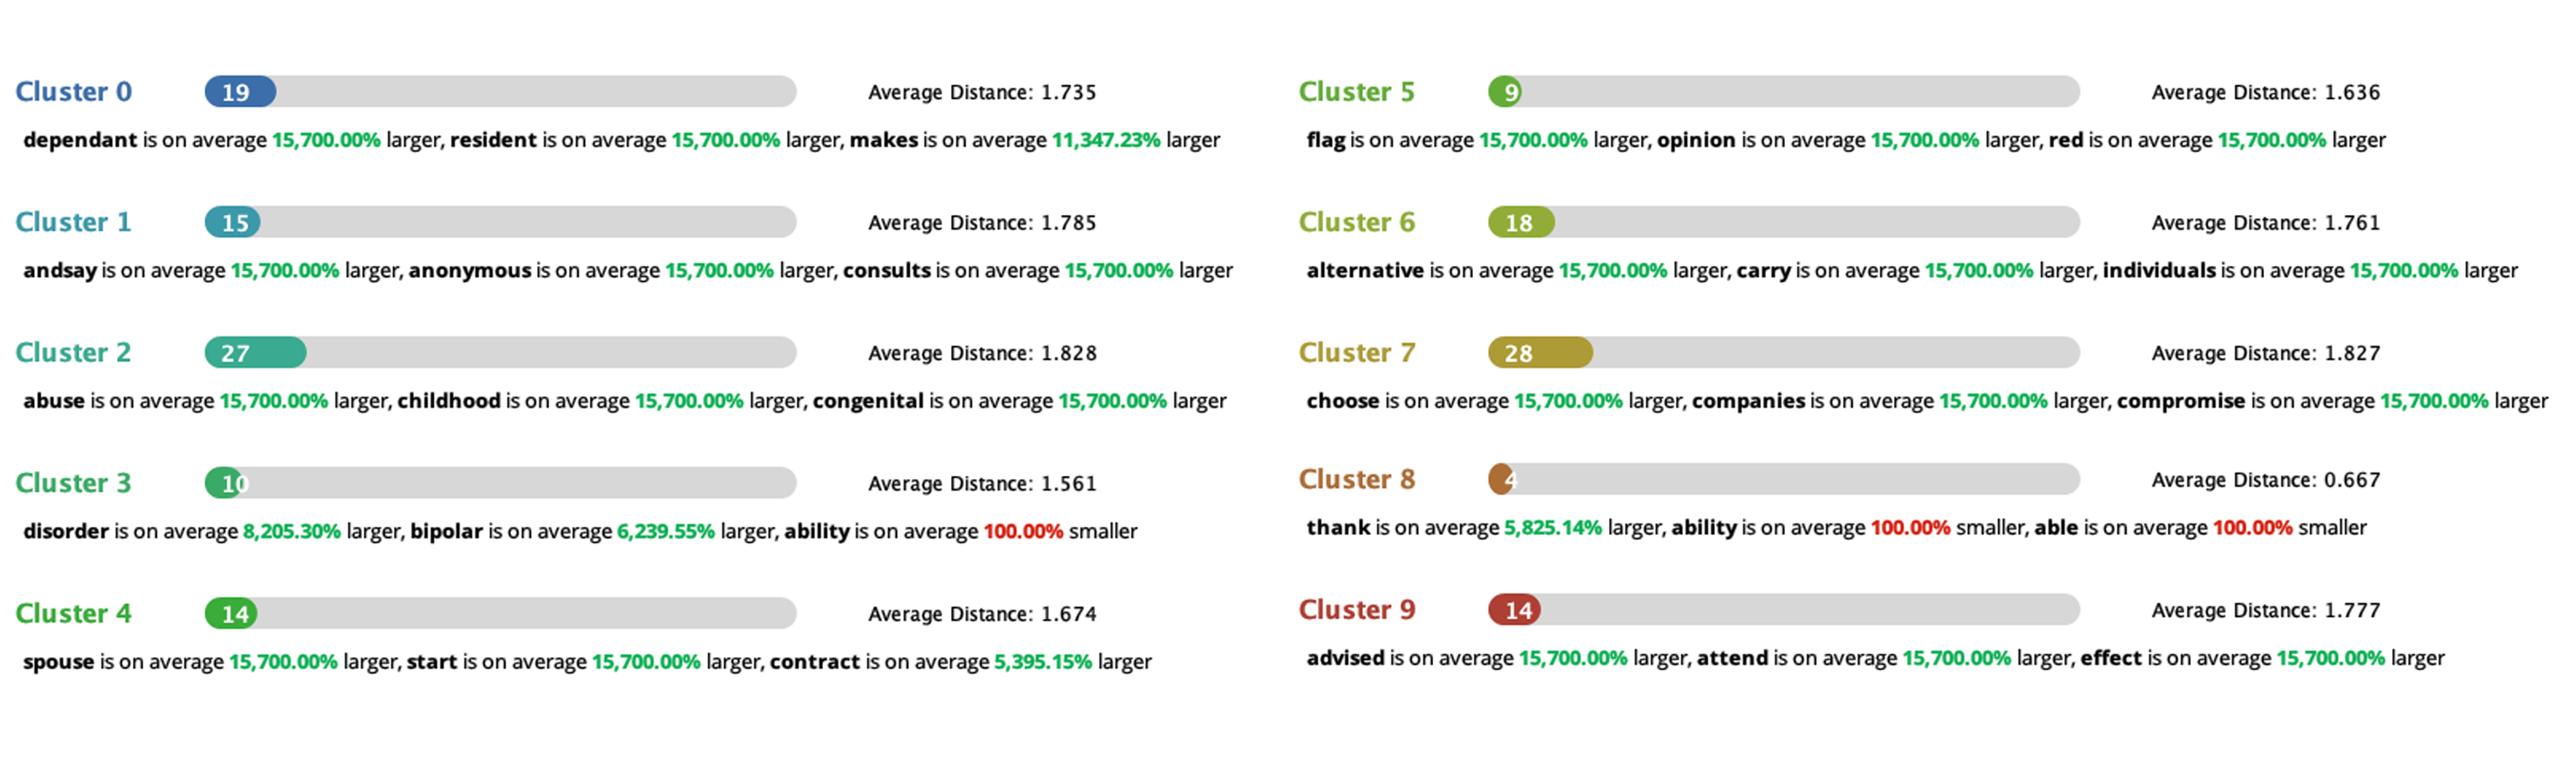
10 Clusters — Are they really representative? (Click to expand)
— At least they all have distinguishable attributes (keywords).
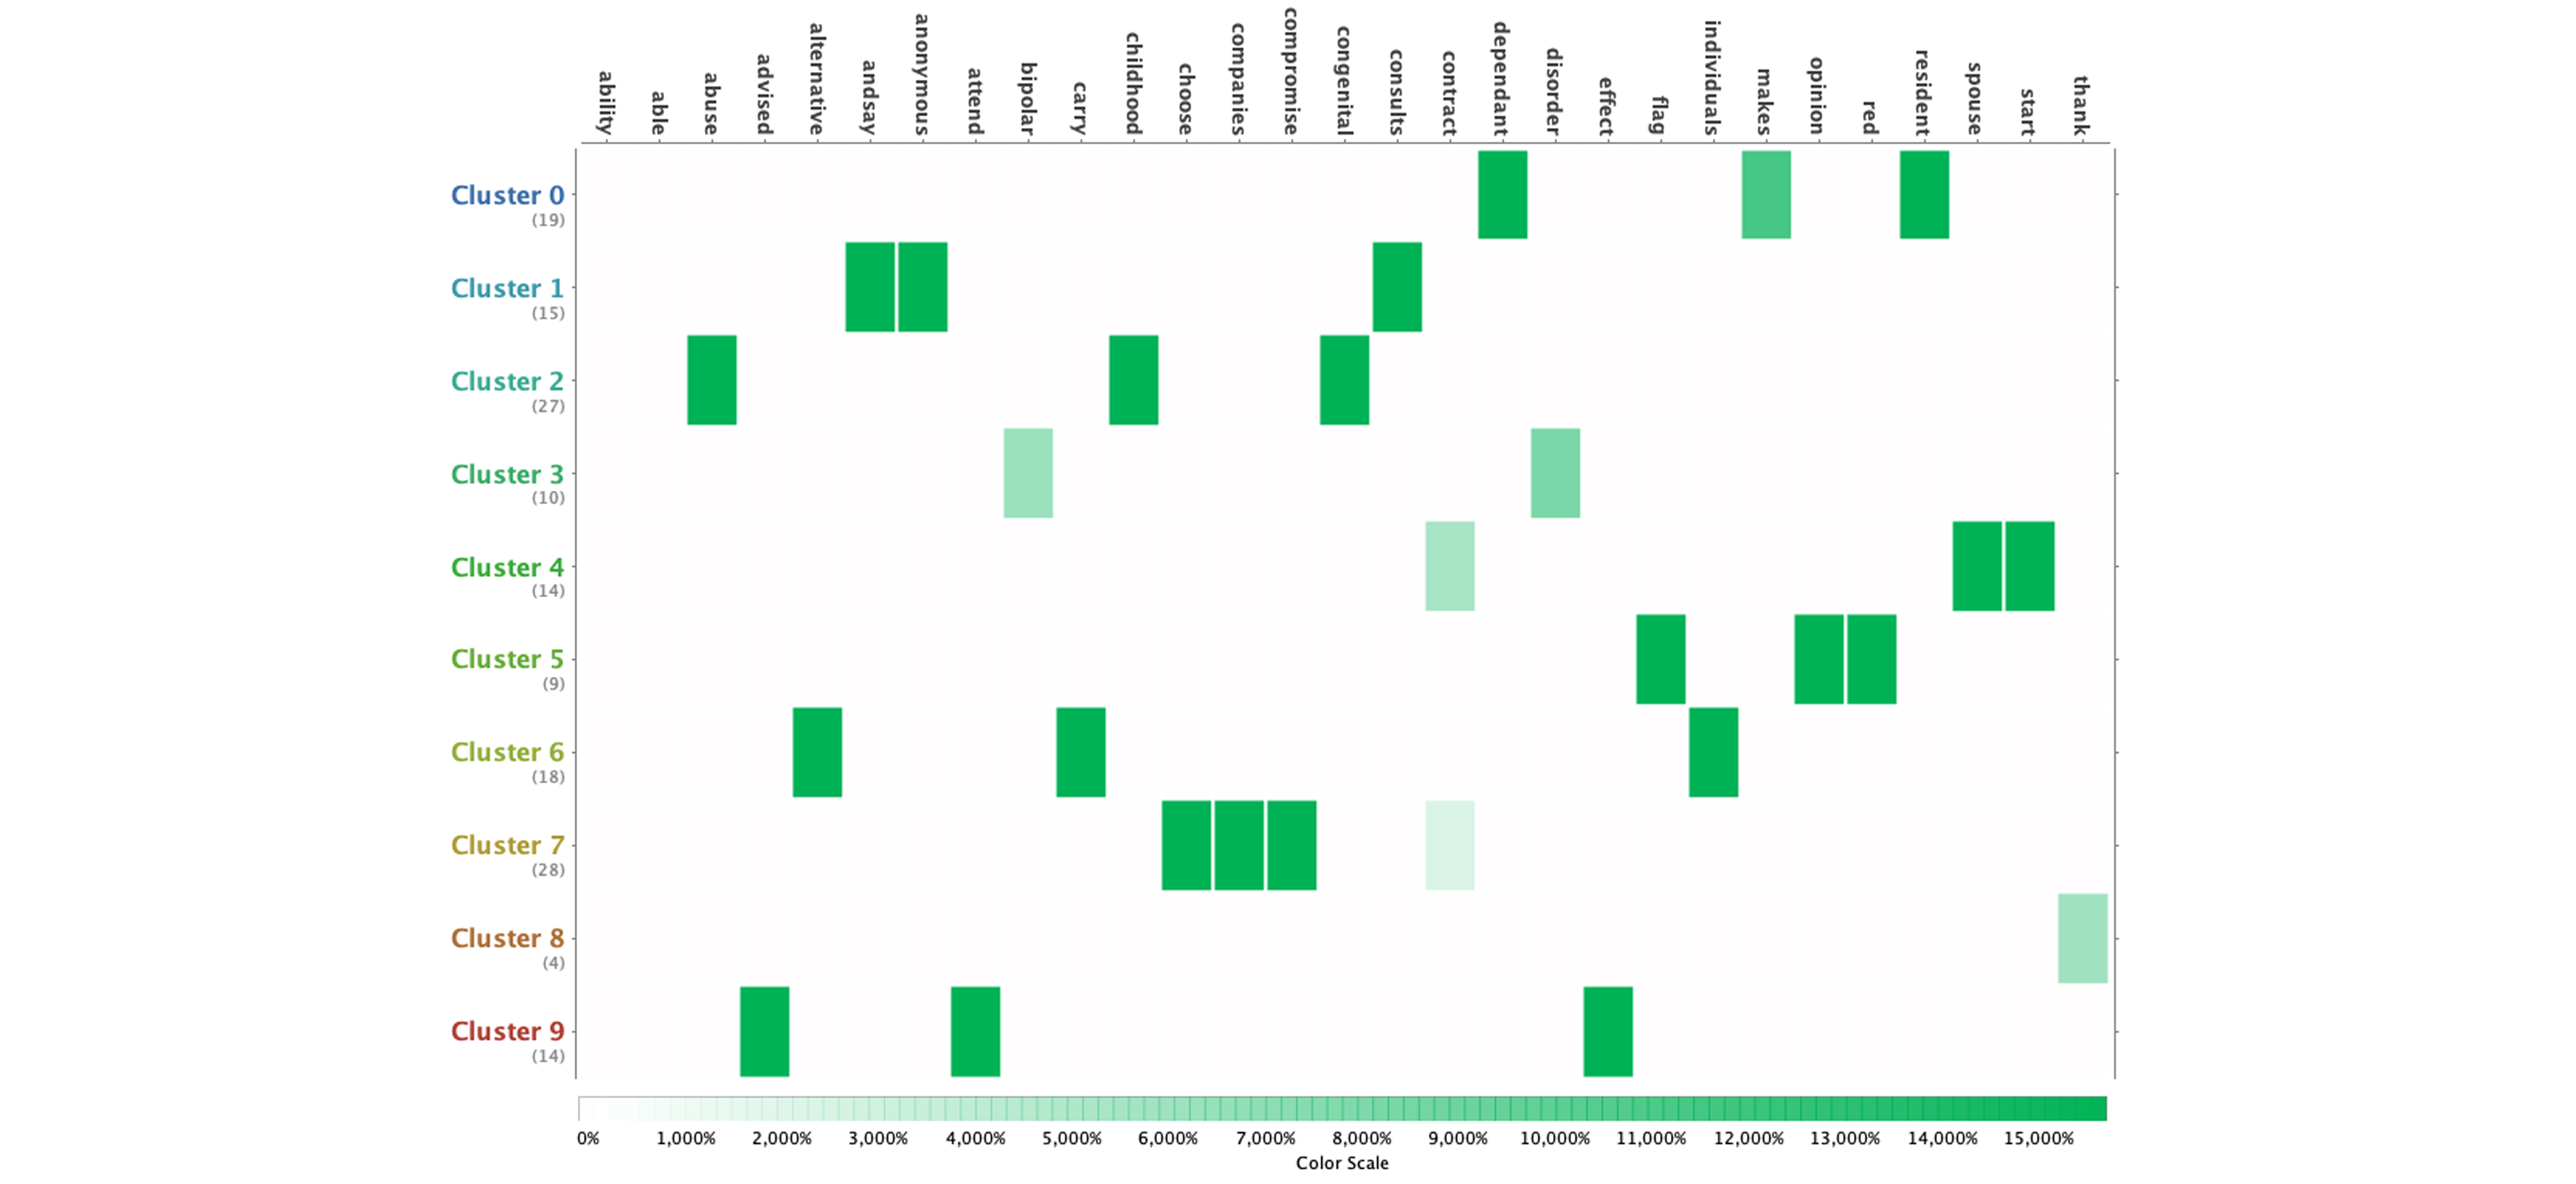
Attributes (Click to expand)